Parallel coordinates plot of a DEA panel over time
Source:R/plot-panel-io-parcoo.R
plot_panel_io_parcoo.RdDraws a parallel-coordinates view of panel (multi-period) DEA data: the periods form the parallel axes, and each DMU is one line tracing the chosen quantity across time. The quantity on the vertical axis is either a single input/output variable (raw values) or the per-period DEA efficiency score.
Usage
plot_panel_io_parcoo(
  panel_data,
  y,
  inputs = NULL,
  outputs = NULL,
  id = "Label",
  period = "Period",
  orientation = "in",
  color_by_trend = FALSE,
  labels = "none",
  max.overlaps.value = 10,
  transparency = 0.7,
  fade = TRUE,
  x_angle = NULL,
  subtitle = NULL,
  title = NULL,
  interactive = FALSE,
  ...
)
Arguments
- panel_data
A data frame in long format (one row per DMU-period), or a
dea_panel_dataobject – in which caseinputs,outputs,idandperiodare taken from the object and those arguments are ignored.- y
What to trace over time:
"crs"or"vrs"for the per-period efficiency score, or the name or integer position of a single input/output column inpanel_data. (If a data column is literally named"crs"or"vrs", pass its position instead.)- inputs, outputs
Optional column selectors (names or integer positions) identifying the inputs and outputs, used when
yis an efficiency model and column names are noti_/o_prefixed.- id, period
Columns (name or position) identifying the DMU and the period. Defaults
"Label"and"Period".- orientation
Measurement orientation for the efficiency scores, passed to
compute_efficiency(default"in").- color_by_trend
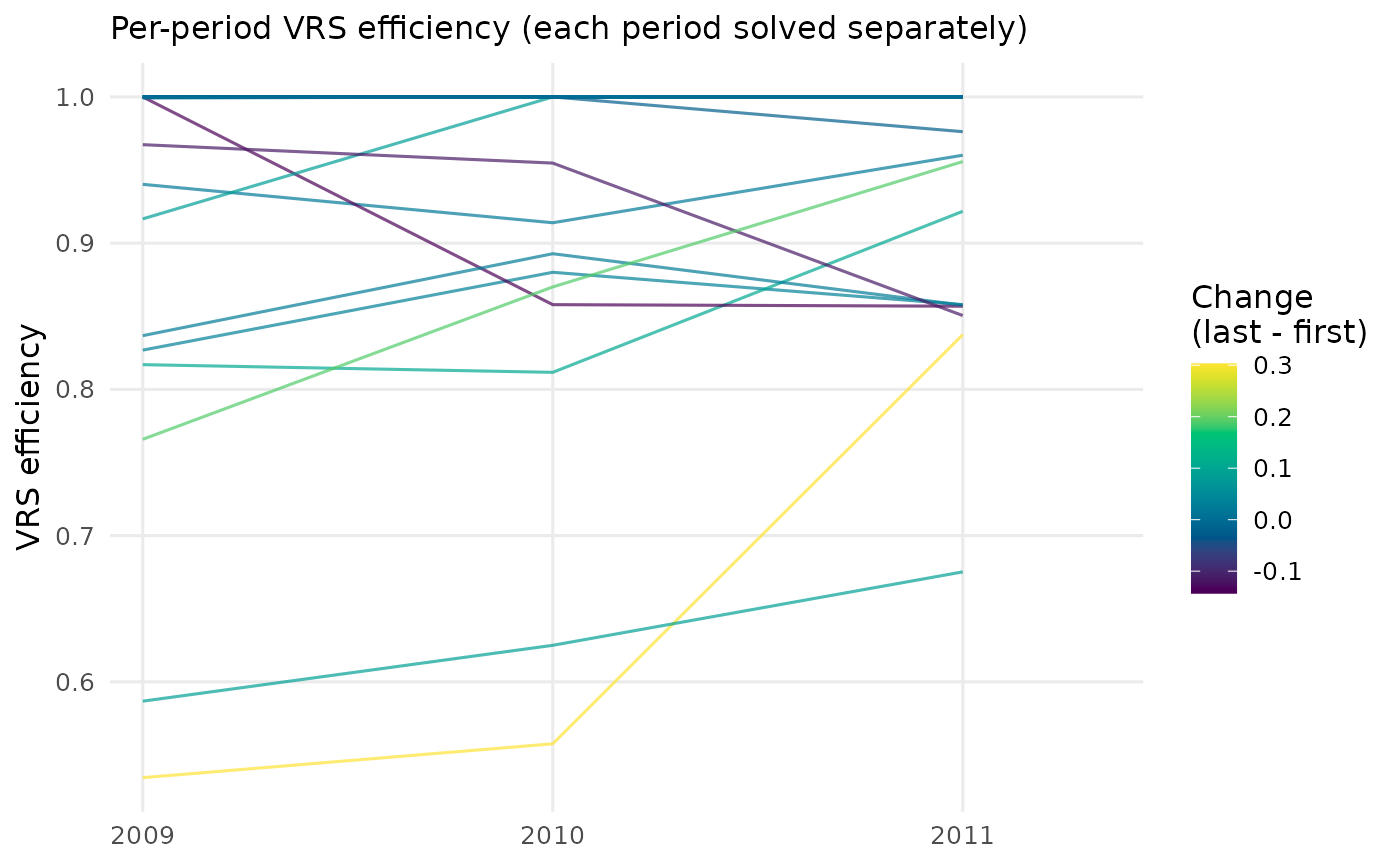
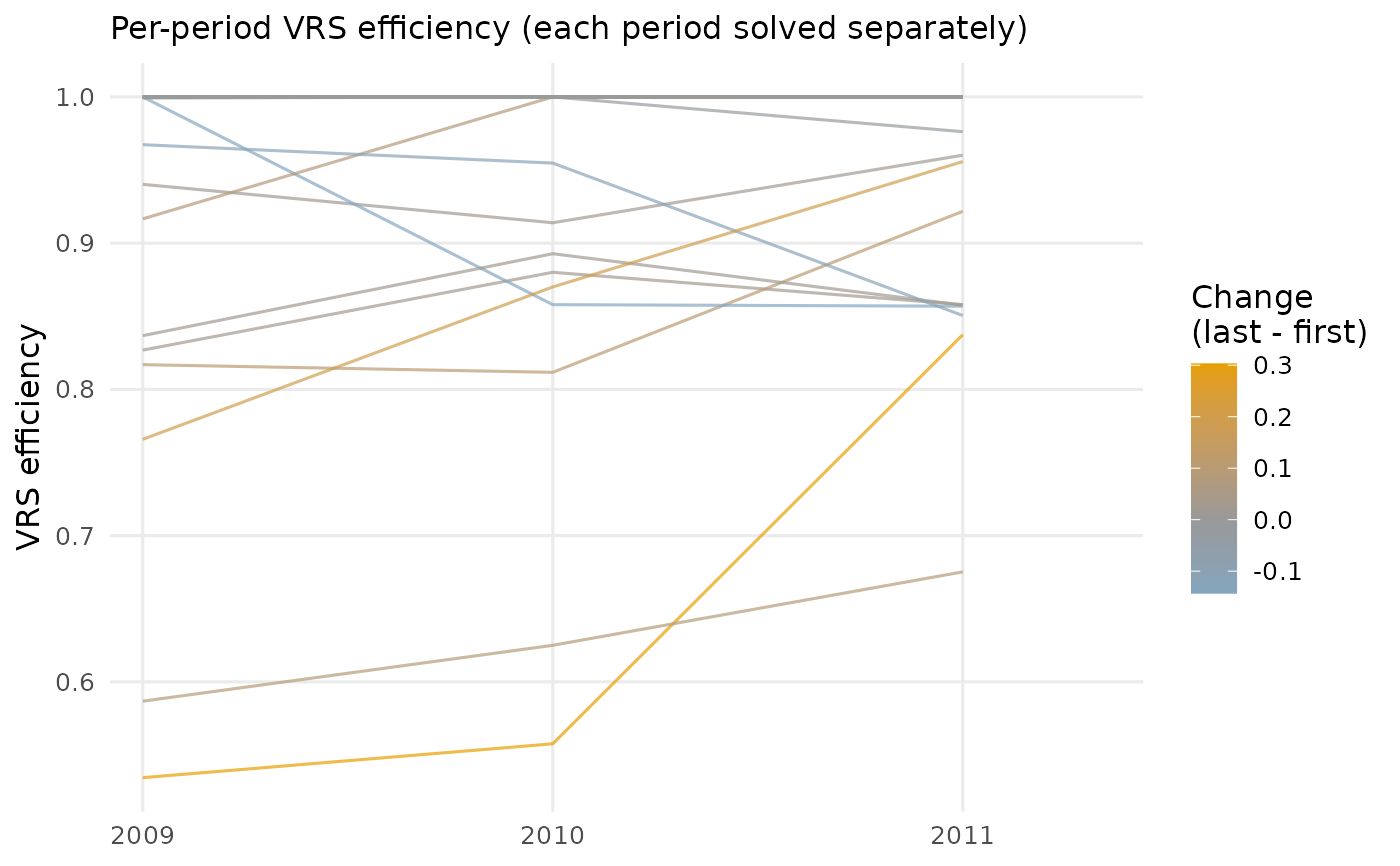
Colour each DMU's line by its overall change over the panel (last observed value minus first).
FALSE(default) uses a single colour;TRUEmaps the change onto the package's sequential (viridis) palette;"diverging"uses a scale anchored at zero built from the package's status colours (orange for increases, grey for no change, sky blue for decreases).- labels
Which DMUs to label at the right-hand axis:
"none"(default),"all","id","max.overlaps", or the name of a single DMU (also highlights that DMU's line).- max.overlaps.value
Passed to ggrepel when
labels = "max.overlaps"(default10).- transparency
Opacity of the lines, a single number in
[0, 1](default0.7).- fade
Controls the single-DMU focus view. When one DMU is given to
labels, the other lines are faded so the chosen DMU stands out.TRUE(default) uses a sensible fade level;FALSEdisables it; a single number in[0, 1]sets the alpha of the faded lines directly, where larger values fade them less.- x_angle
Angle in degrees for the x-axis tick labels, useful when the period labels are long.
NULL(default) keeps them horizontal.- subtitle
Optional subtitle shown beneath the title.
NULL(default) shows a note naming what is traced; pass a string to override, orNAto suppress.- title
Optional plot title.
- interactive
Logical; static ggplot2 (default) or interactive plotly.
- ...
Additional arguments passed to
geom_line.
Details
When y is "crs" or "vrs", efficiency is computed
separately for each period's cross-section (each period is its own DEA
problem), matching plot_panel_io_biplot. When y names an
input or output column, its raw values are plotted, so the axes share the
variable's natural scale.
Examples
pd <- dea_panel_data(taiwanese_banks, inputs = 3:5, outputs = 6:8,
id = "DMU", period = "Year")
plot_panel_io_parcoo(pd, y = "vrs")
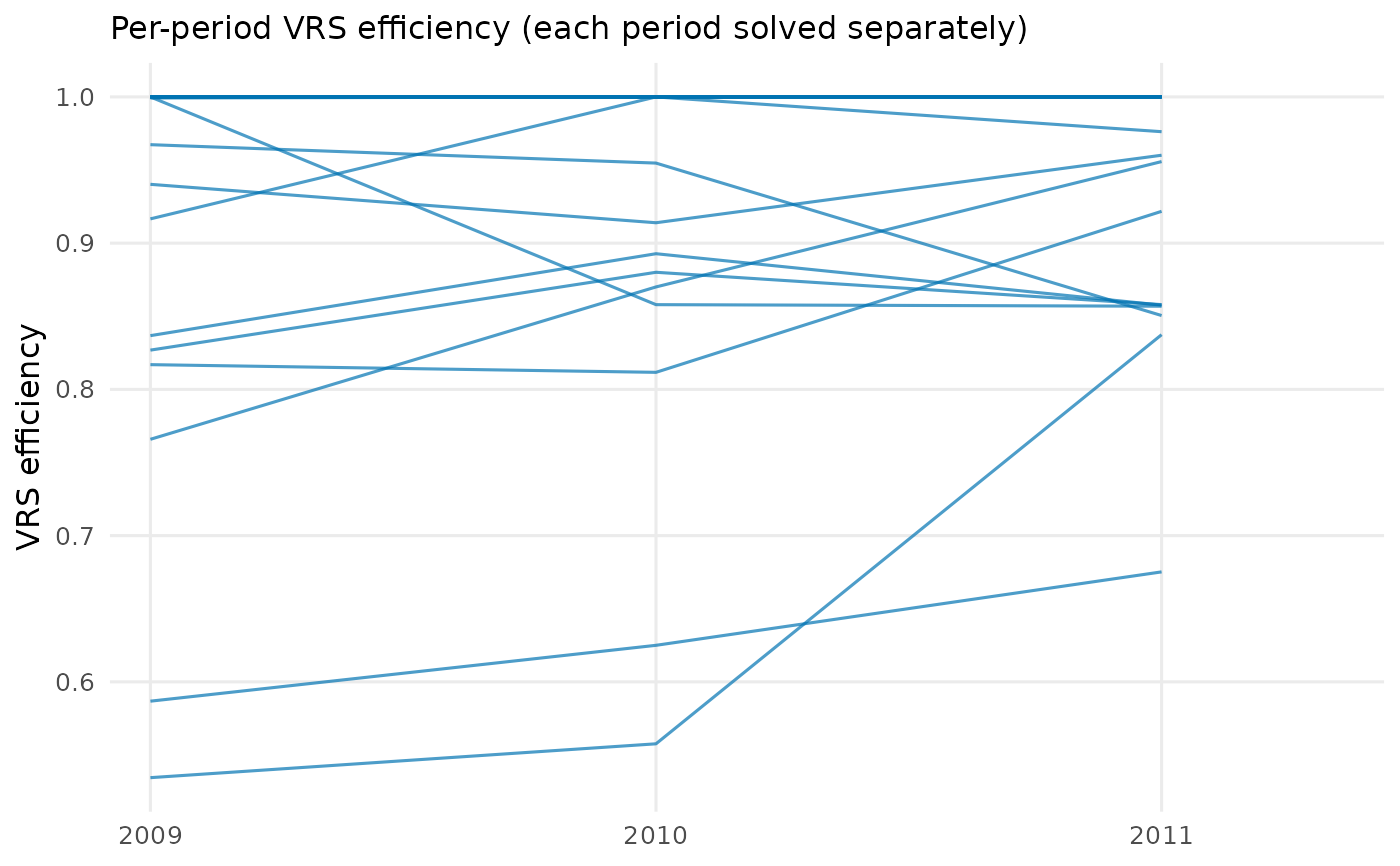 # per-period VRS efficiency of every bank over 2009-2011
plot_panel_io_parcoo(
taiwanese_banks, y = "vrs", id = "DMU", period = "Year",
inputs = 3:5, outputs = 6:8
)
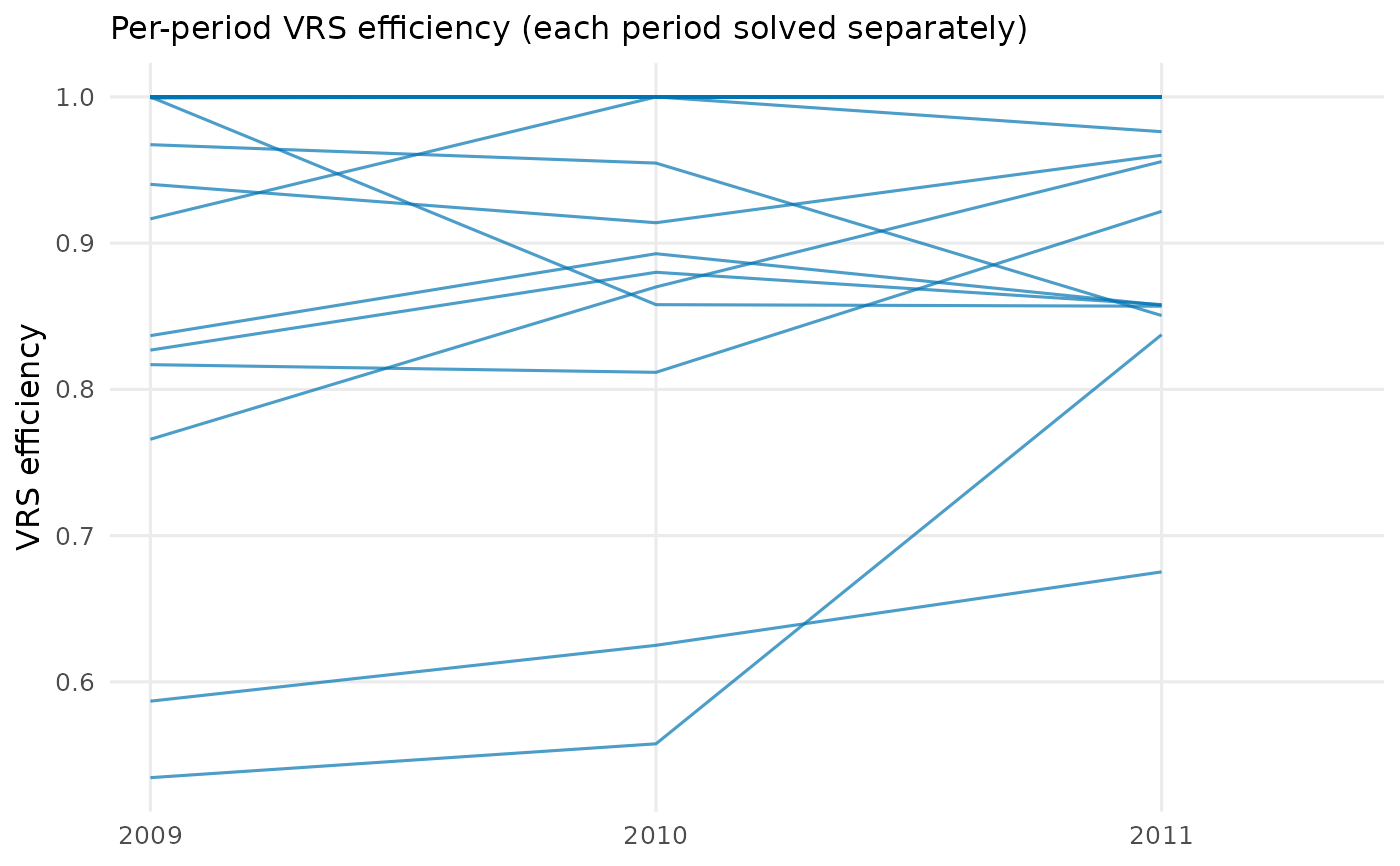 # colour lines by each bank's overall change in efficiency
plot_panel_io_parcoo(
taiwanese_banks, y = "vrs", id = "DMU", period = "Year",
inputs = 3:5, outputs = 6:8, color_by_trend = TRUE
)
 # the same, on a diverging scale anchored at zero
plot_panel_io_parcoo(
taiwanese_banks, y = "vrs", id = "DMU", period = "Year",
inputs = 3:5, outputs = 6:8, color_by_trend = "diverging"
)
 # one raw variable over time, focusing a single bank
plot_panel_io_parcoo(
taiwanese_banks, y = "demand_deposits", id = "DMU", period = "Year",
labels = "Cathay"
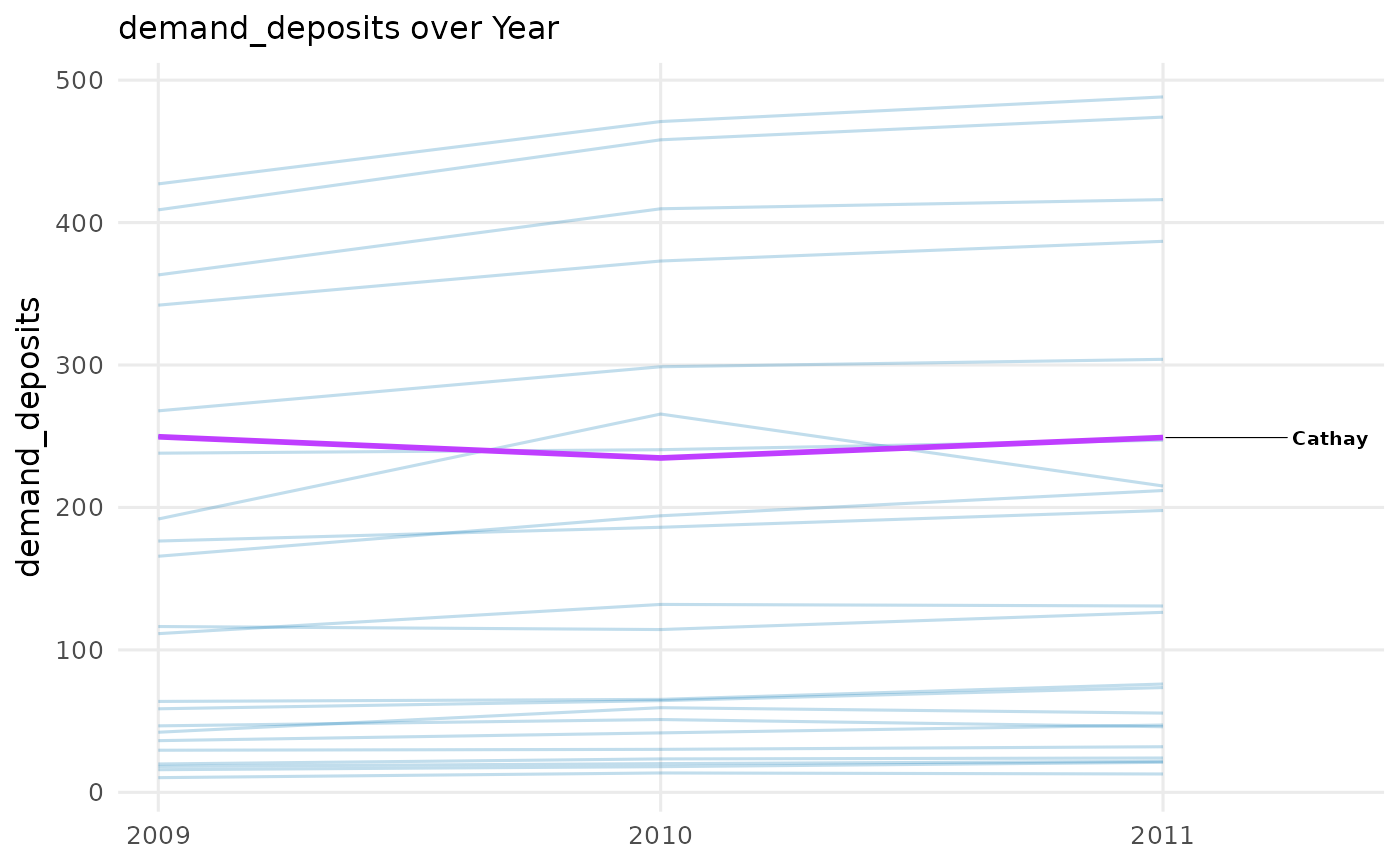
)