Plot the component planes of a DEA self-organizing map
Source:R/plot-io-som-components.R
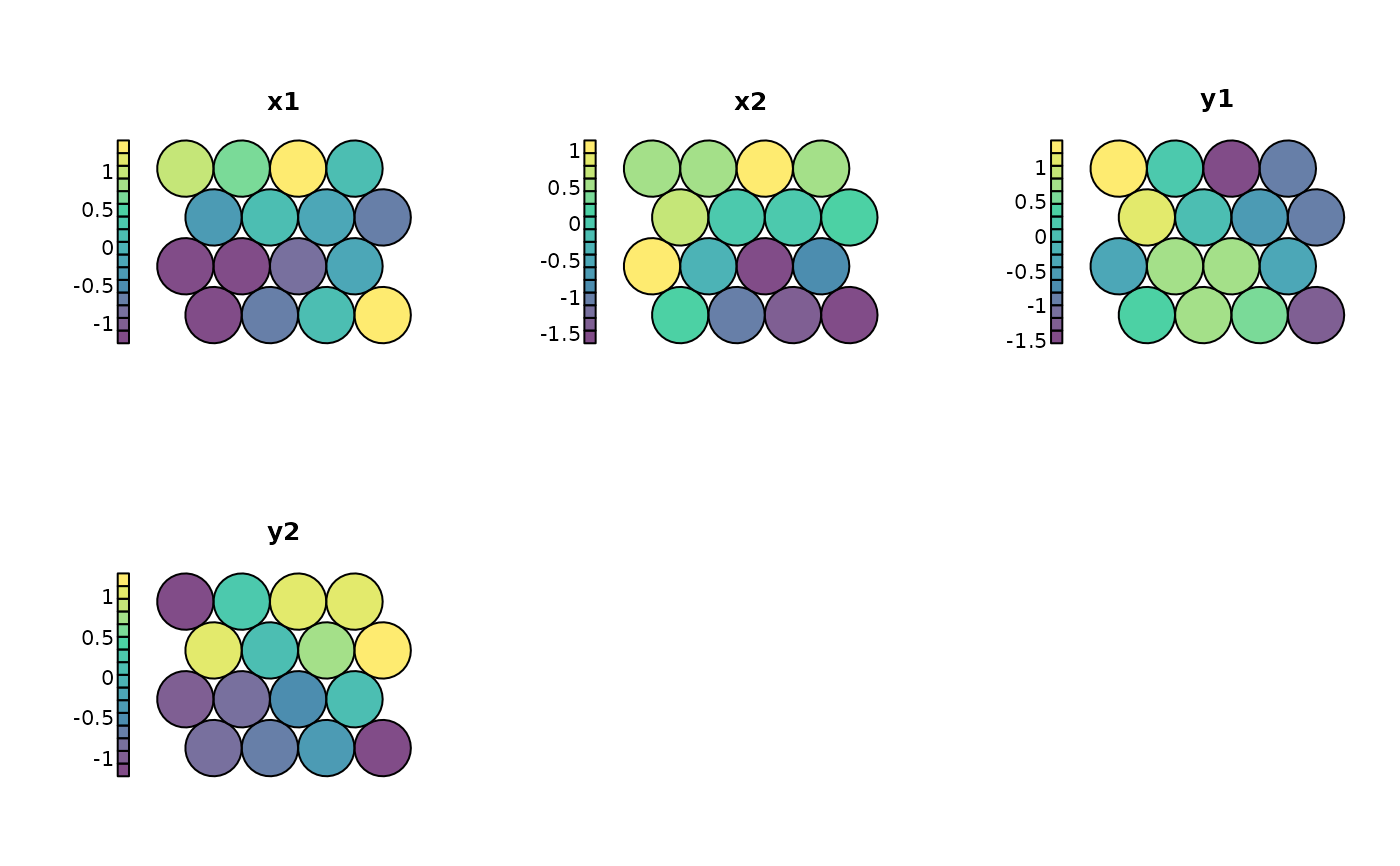
plot_io_som_components.RdDraws one SOM property map per input/output variable – the "component planes" – each node coloured by that variable's codebook weight. This shows how each input and output varies across the trained map. Uses base graphics, so the panels are produced as a side effect on the active device.
Usage
plot_io_som_components(
  som,
  variables = NULL,
  ncol = 3,
  labels = TRUE,
  transparency = 0.7,
  subtitle = NULL,
  title = NULL,
  ...
)
Arguments
- som
A
dea_somobject fromcompute_som, or adea_dataobject / data frame, in which case the map is fitted first.- variables
Optional character vector selecting which variables to draw (default: all). Names are matched against the input/output column names.
- ncol
Number of panels per row (positive integer; default
3).- labels
Logical; if
TRUE(default) each panel is titled with its variable name.- transparency
Opacity of the markers/areas, a single number in
[0, 1](default0.7).- subtitle
Optional subtitle shown beneath the title.
- title
Optional overall title drawn above the panel grid.
- ...
When
somis data rather than adea_som, further arguments passed tocompute_som.
Examples
df <- data.frame(
  dmu  = paste0("D", 1:12),
  i_x1 = runif(12, 2, 9), i_x2 = runif(12, 1, 5),
  o_y1 = runif(12, 3, 9), o_y2 = runif(12, 1, 4)
)
som <- compute_som(df, xdim = 4, ydim = 4, seed = 1)
plot_io_som_components(som)