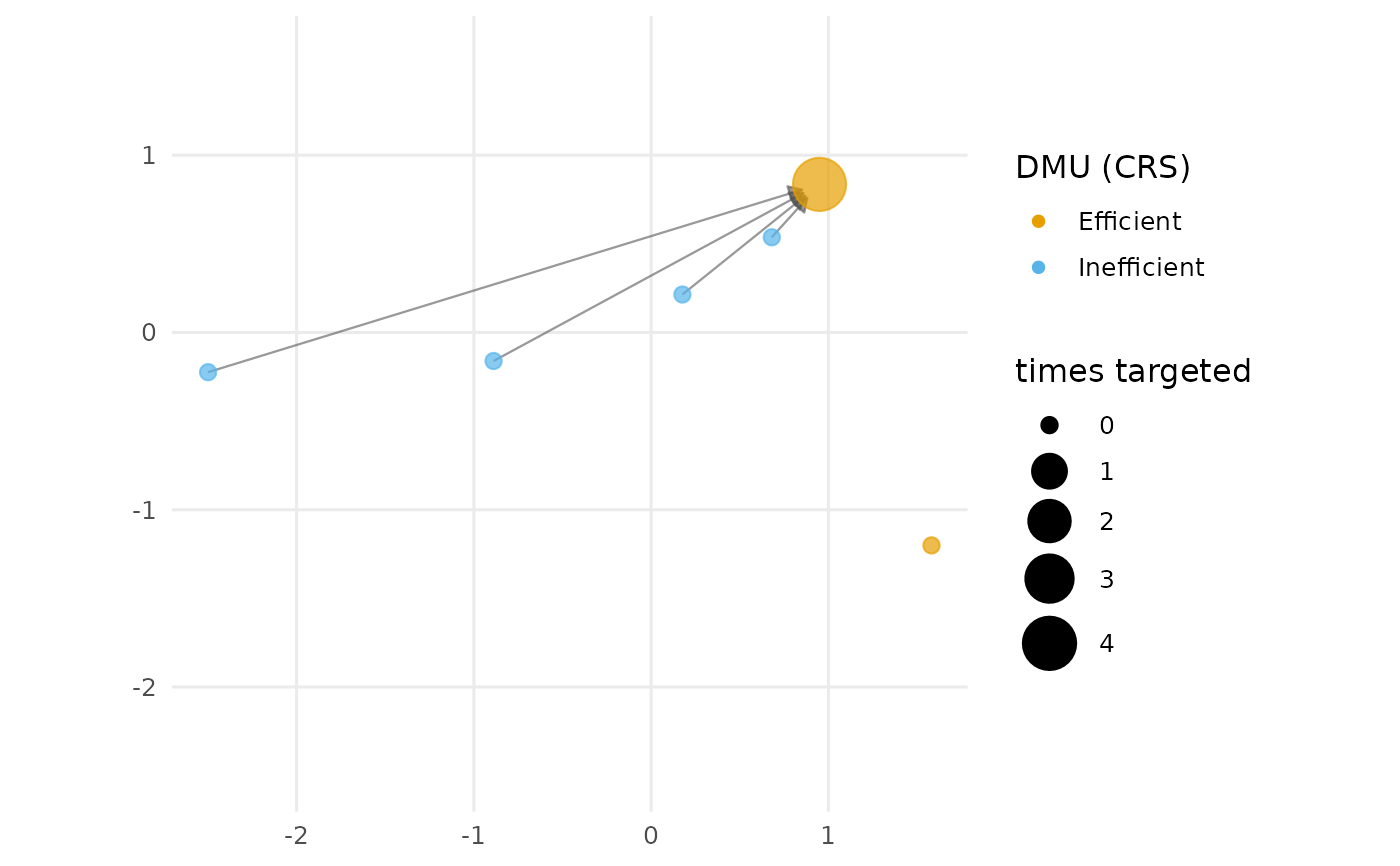
Draws a directed network of DMUs: each inefficient unit has arrows pointing to its efficient peers (the targets in its DEA reference set, i.e. the efficient units with a positive envelopment weight). Arrowheads stop short of the target node so the direction stays readable. Nodes are coloured by efficiency status and, optionally, efficient nodes are sized by how often they are a target.
Arguments
- x
A
dea_dataobject, or a data frame coerced byas_dea_data.- rts
Returns to scale, passed to
compute_efficiency:"crs"or"vrs".- layout
Node layout:
"pca"(default, first two principal components of the standardised inputs/outputs),"mds"(classical multidimensional scaling),"circle","fr"(Fruchterman-Reingold force-directed) or"stress"(stress majorization). The last two require the igraph package (and graphlayouts for true stress majorization; otherwise a Kamada-Kawai layout is used).- size_by_peers
Logical; if
TRUE, efficient nodes are sized by the number of inefficient units that target them. IfFALSE(default) all nodes have the same size.- tol
Tolerance for a positive envelopment weight (default
1e-6).- labels
Which DMUs to label:
"none"(default),"all"(label every DMU; ggrepel withmax.overlaps = Inf),"max.overlaps"(ggrepel usingmax.overlaps.value), or the name/id of a single DMU to highlight just that one. Use"id"to print each DMU's row number inside its own marker.- max.overlaps.value
Passed to ggrepel when
labels = "max.overlaps"(default10); larger values keep more crowded labels.- transparency
Node alpha in
[0, 1](default0.7); lower values reveal overlapping nodes.- fade
Controls the single-DMU focus view. When one DMU is given to
labels, all other marks (and, for the network plots, everything outside that DMU's sub-network; for the panel biplot, the other trajectories) are faded so the chosen DMU stands out.TRUE(default) uses a sensible fade level;FALSEdisables it; a single number in[0, 1]sets the alpha of the faded marks directly, where larger values fade them less (e.g.0.4leaves them more visible).- subtitle
Optional subtitle shown beneath the title.
- title
Optional plot title.
- interactive
Logical; static ggplot2 (default) or interactive plotly.
- ...
Additional arguments passed to
geom_point.
Examples
df <- data.frame(
  dmu  = paste0("D", 1:6),
  i_x1 = c(4, 7, 8, 4, 2, 5),
  i_x2 = c(3, 3, 1, 2, 4, 2),
  o_y  = c(5, 8, 6, 7, 3, 9)
)
plot_io_peer_network(df, rts = "crs", size_by_peers = TRUE)