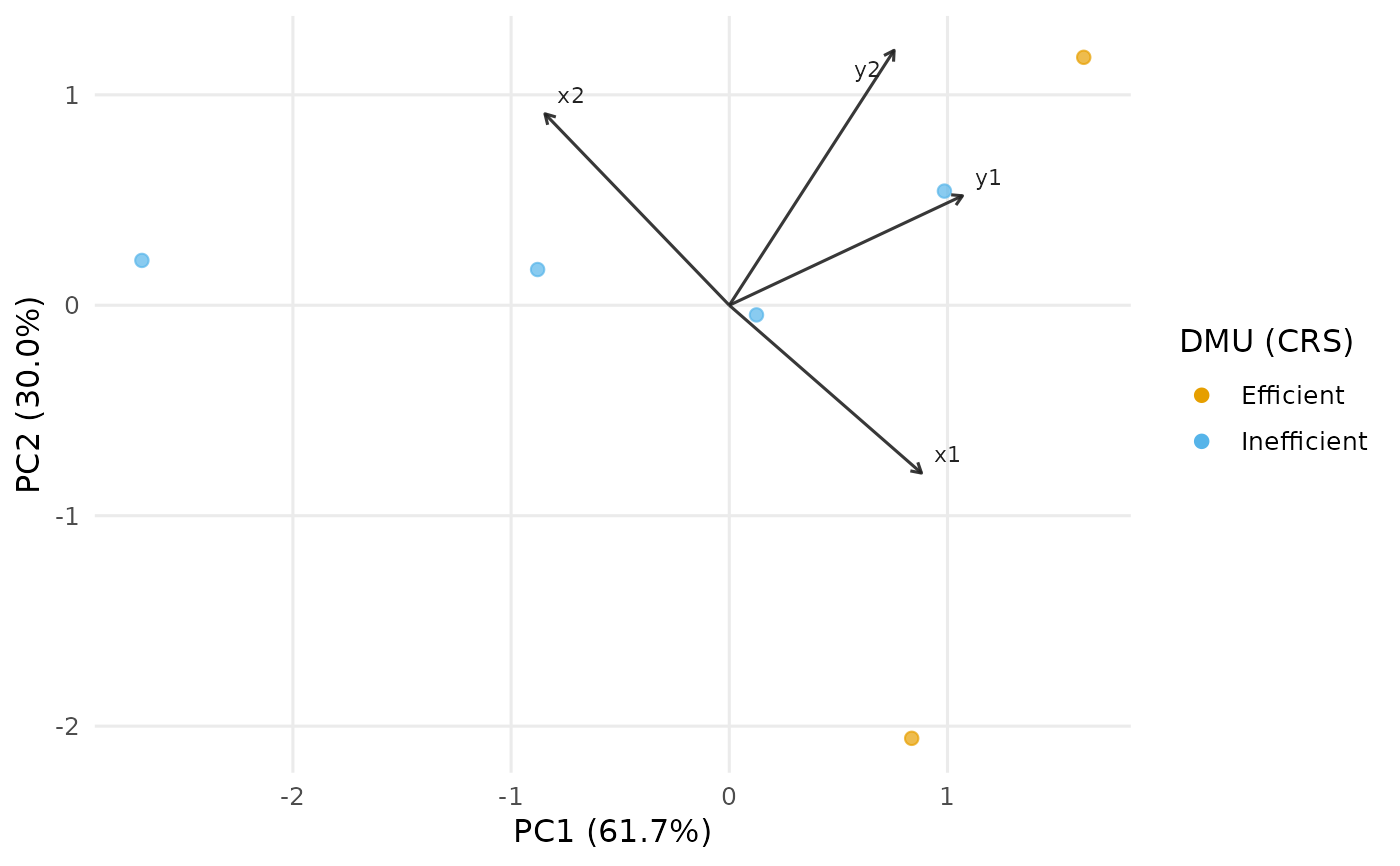
Runs a principal component analysis on the standardised input/output data and
draws a biplot: DMUs as points coloured by efficiency status, and the
variables as labelled vectors. Efficiency comes from
compute_efficiency.
Usage
plot_io_pca_biplot(
  x,
  rts = c("crs", "vrs"),
  vector_size = 1,
  text_size = 3,
  labels = "none",
  max.overlaps.value = 10,
  transparency = 0.7,
  fade = TRUE,
  subtitle = NULL,
  title = NULL,
  interactive = FALSE,
  seed = NA,
  ...
)
Arguments
- x
A
dea_dataobject, or a data frame coerced byas_dea_data.- rts
Returns to scale, passed to
compute_efficiency:"crs"or"vrs".- vector_size
Positive multiplier scaling the length of the variable vectors relative to the point cloud (default
1).- text_size
Size of the variable labels (default
3).- labels
Which DMUs to label:
"none"(default),"all"(label every DMU; ggrepel withmax.overlaps = Inf),"max.overlaps"(ggrepel usingmax.overlaps.value), or the name/id of a single DMU to highlight just that one. Use"id"to print each DMU's row number inside its own marker.- max.overlaps.value
Passed to ggrepel when
labels = "max.overlaps"(default10); larger values keep more crowded labels.- transparency
Point alpha in
[0, 1](default0.7).- fade
Controls the single-DMU focus view. When one DMU is given to
labels, all other marks (and, for the network plots, everything outside that DMU's sub-network; for the panel biplot, the other trajectories) are faded so the chosen DMU stands out.TRUE(default) uses a sensible fade level;FALSEdisables it; a single number in[0, 1]sets the alpha of the faded marks directly, where larger values fade them less (e.g.0.4leaves them more visible).- subtitle
Optional subtitle shown beneath the title.
- title
Optional plot title.
- interactive
Logical; static ggplot2 (default) or interactive plotly.
- seed
Optional seed for
geom_text_repellabel placement (static mode only). DefaultNA.- ...
Additional arguments passed to
geom_point.