Efficiency scores of the DMUs
Source:R/plot-efficiency-distributions.R
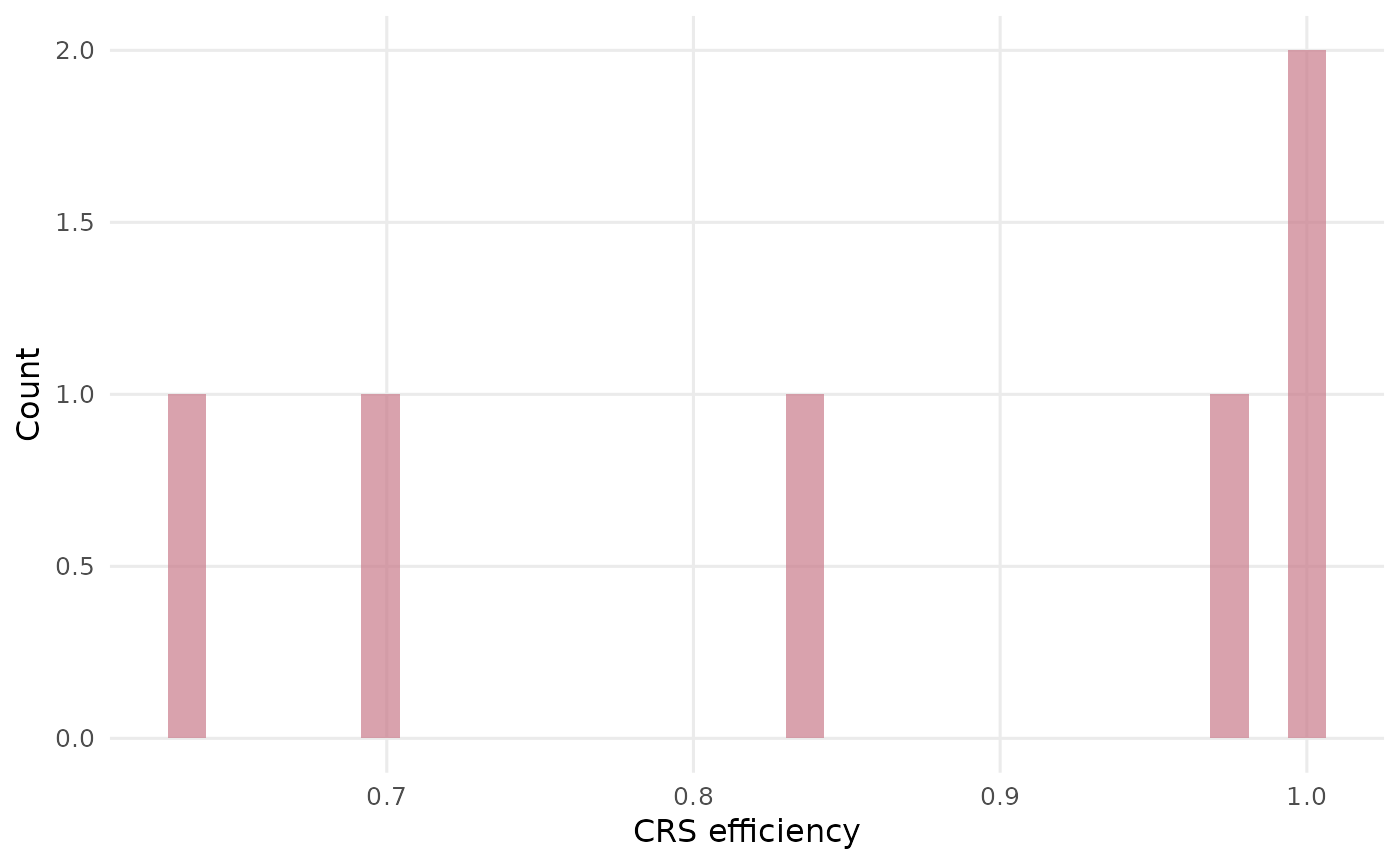
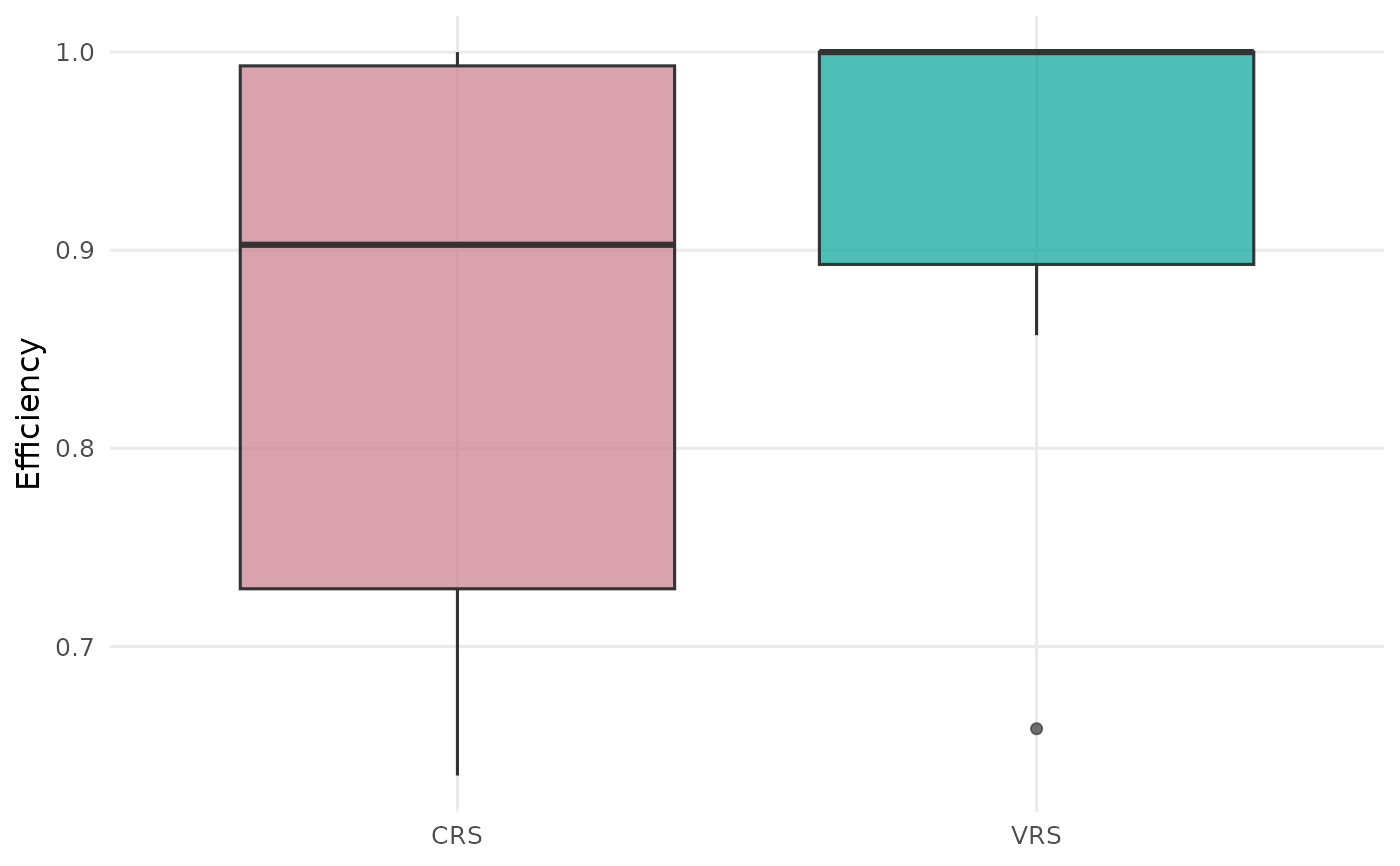
plot_efficiency_distributions.RdSummarises the DEA efficiency scores of the decision-making units as a histogram (default), a boxplot, or a per-DMU bar chart. More than one returns-to-scale model can be requested at once: histograms are then stacked vertically (one panel per model) and boxplots are drawn side by side, each model in its own colour.
Usage
plot_efficiency_distributions(
  x,
  rts = "crs",
  orientation = "in",
  type = c("histogram", "box", "bar"),
  bins = 30,
  labels = "none",
  max.overlaps.value = 10,
  transparency = 0.7,
  subtitle = NULL,
  title = NULL,
  interactive = FALSE,
  ...
)
Arguments
- x
A
dea_dataobject, or a data frame coerced byas_dea_data.- rts
Returns-to-scale model(s) passed to
compute_efficiency; a character vector with any of"crs"(default),"vrs","drs","irs","fdh","add". Supplying more than one compares models.- orientation
Measurement orientation passed to
compute_efficiency.- type
"histogram"(default),"box", or"bar"(one bar per DMU).- bins
Number of histogram bins (used when
type = "histogram").- labels
Which DMUs to mark:
"none"(default),"all"(rug on histograms, jittered points on boxplots), or the name/id of a single DMU to mark with a dashed line (histogram), a point (boxplot), or a highlighted axis label (bar).- max.overlaps.value
Accepted for API consistency; unused here (default
10).- transparency
Opacity of the markers/areas, a single number in
[0, 1](default0.7).- subtitle
Optional subtitle shown beneath the title.
- title
Optional plot title.
- interactive
Logical; static ggplot2 (default) or interactive plotly.
- ...
Additional arguments passed to the underlying geom.