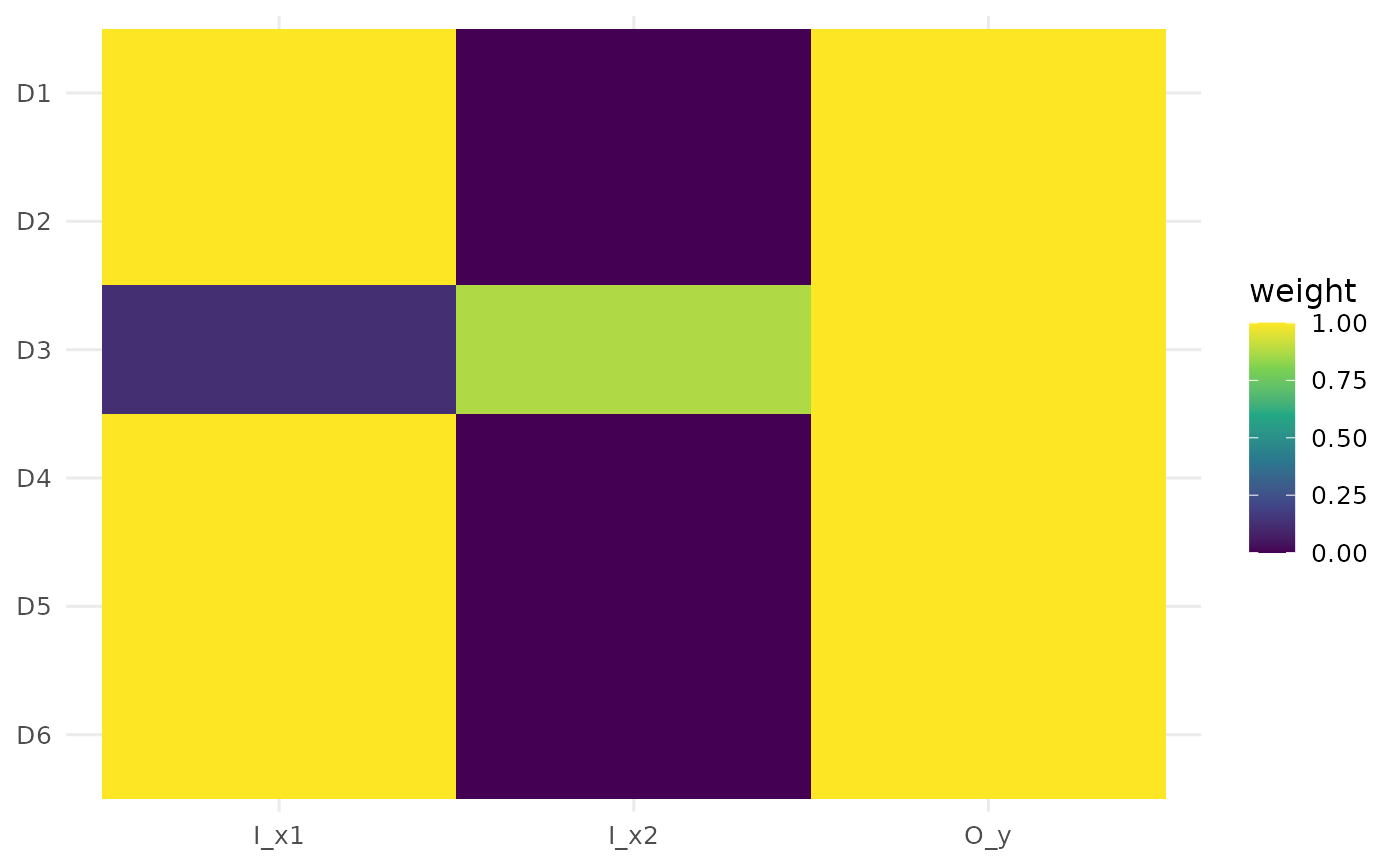
Heatmap of secondary-goal multiplier weights
Source:R/plot-cem-weights-heatmap.R
plot_cem_weights_heatmap.RdDraws a heatmap of each DMU's secondary-goal (benevolent or aggressive) multiplier weights, one row per DMU and one column per input/output. By default the weights are row-standardised (input weights sum to one, output weights sum to one within each DMU) so the relative emphasis is comparable across units.
Usage
plot_cem_weights_heatmap(
  x,
  approach = c("benevolent", "aggressive"),
  standardize = TRUE,
  labels = "all",
  max.overlaps.value = 10,
  transparency = 1,
  fade = TRUE,
  x_angle = NULL,
  subtitle = NULL,
  title = NULL,
  interactive = FALSE,
  ...
)
Arguments
- x
A weights list from
compute_cross_efficiency_weights, or adea_dataobject / data frame from which the weights are computed.- approach
Secondary goal used when the weights are computed from data:
"benevolent"(default) or"aggressive". Ignored whenxis an already-computed weights list.- standardize
Logical; if
TRUE(default) the weights are row-standardised withstandardize_weightsbefore plotting.- labels
DMU tick labels:
"all"(default) shows them,"none"hides them, and the name/id of a single DMU highlights that DMU's label(s) in colour.- max.overlaps.value
Accepted for API consistency; unused here (default
10).- transparency
Opacity of the markers/areas, a single number in
[0, 1](default1).- fade
Controls the single-DMU focus view. When one DMU is given to
labels, all other marks (and, for the network plots, everything outside that DMU's sub-network; for the panel biplot, the other trajectories) are faded so the chosen DMU stands out.TRUE(default) uses a sensible fade level;FALSEdisables it; a single number in[0, 1]sets the alpha of the faded marks directly, where larger values fade them less (e.g.0.4leaves them more visible).- x_angle
Angle in degrees for the x-axis tick labels, useful when the input/output (or DMU) names on the x-axis are long and overlap.
NULL(default) keeps the plot's standard orientation; for examplex_angle = 45tilts the labels to make them readable.- subtitle
Optional subtitle shown beneath the title.
- title
Optional plot title.
- interactive
Logical; static ggplot2 (default) or interactive plotly.
- ...
When
xis data, further arguments passed tocompute_cross_efficiency_weights.
References
Doyle, J., & Green, R. (1994). Efficiency and cross-efficiency in DEA: Derivations, meanings and uses. Journal of the Operational Research Society, 45(5), 567–578. doi:10.1057/jors.1994.84
Examples
df <- data.frame(
  dmu  = paste0("D", 1:6),
  i_x1 = c(4, 7, 8, 4, 2, 5),
  i_x2 = c(3, 3, 1, 2, 4, 2),
  o_y  = c(5, 8, 6, 7, 3, 9)
)
plot_cem_weights_heatmap(df, approach = "benevolent")