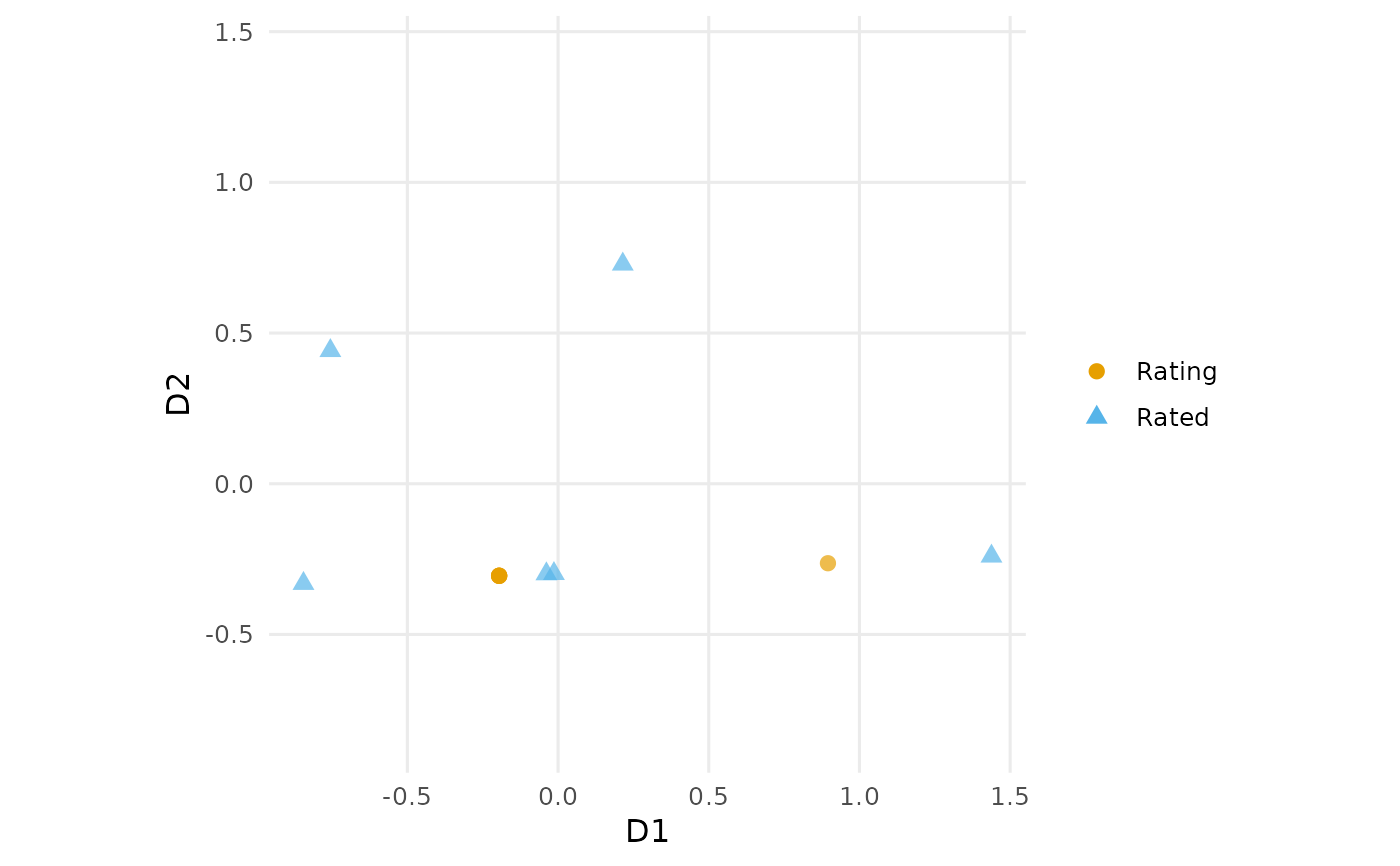
Applies multidimensional unfolding (Ashkiani and Mar-Molinero, 2017) to a
cross-efficiency matrix, placing each DMU twice – once as a "rating" unit
(the weights it applies) and once as a "rated" unit – so that a rating unit
sits close to the units it scores highly. Dissimilarities are taken as
1 - CEM.
Usage
plot_cem_unfolding(
  x,
  labels = "none",
  max.overlaps.value = 10,
  transparency = 0.7,
  fade = TRUE,
  subtitle = NULL,
  title = NULL,
  interactive = FALSE,
  ...
)
Arguments
- x
A cross-efficiency matrix from
compute_cross_efficiency, or adea_dataobject / data frame from which one is computed.- labels
Which DMUs to label:
"none"(default),"all"(label every DMU; ggrepel withmax.overlaps = Inf),"max.overlaps"(ggrepel usingmax.overlaps.value), or the name/id of a single DMU to highlight just that one. Use"id"to print each DMU's row number inside its own marker.- max.overlaps.value
Passed to ggrepel when
labels = "max.overlaps"(default10); larger values keep more crowded labels.- transparency
Opacity of the markers/areas, a single number in
[0, 1](default0.7).- fade
Controls the single-DMU focus view. When one DMU is given to
labels, all other marks (and, for the network plots, everything outside that DMU's sub-network; for the panel biplot, the other trajectories) are faded so the chosen DMU stands out.TRUE(default) uses a sensible fade level;FALSEdisables it; a single number in[0, 1]sets the alpha of the faded marks directly, where larger values fade them less (e.g.0.4leaves them more visible).- subtitle
Optional subtitle shown beneath the title.
- title
Optional plot title.
- interactive
Logical; static ggplot2 (default) or interactive plotly.
- ...
When
xis data rather than a matrix, further arguments (e.g.approach,epsilon) passed tocompute_cross_efficiency.
References
Ashkiani, S., & Mar-Molinero, C. (2017). Visualization of cross-efficiency matrices using multidimensional unfolding. In Recent Applications of Data Envelopment Analysis.
Examples
df <- data.frame(
  dmu  = paste0("D", 1:6),
  i_x1 = c(4, 7, 8, 4, 2, 5),
  i_x2 = c(3, 3, 1, 2, 4, 2),
  o_y  = c(5, 8, 6, 7, 3, 9)
)
ce <- compute_cross_efficiency(df)
plot_cem_unfolding(ce)